Introduction
This page provides a quick introduction to the subject of cartograms.
There are more types of cartograms than are described here;
the material is limited to the types of cartograms
that can be generated with the software
available from this site.
According to Wikipedia,
"a cartogram is a map in which some thematic variable —
such as travel time, population, or Gross National Product —
is substituted for land area or distance."
Such maps have become quite popular for summarizing
the state-by-state results in US Presidential elections
every four years.
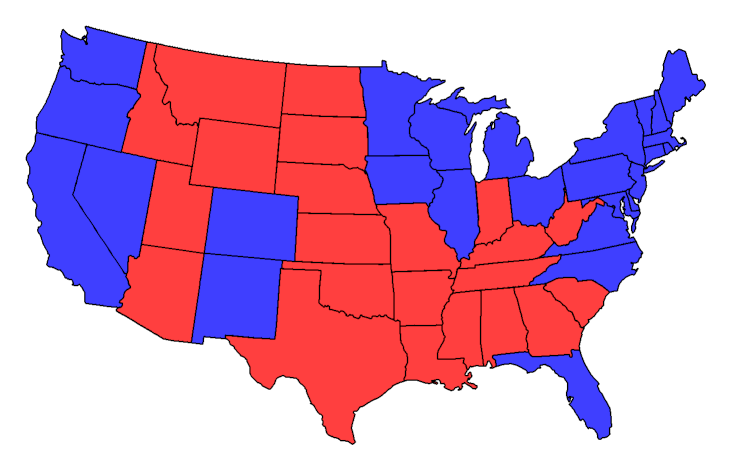
A red-blue coloring of the contiguous states and Washington, DC
representing wins for the Republican and Democratic candidates respectively
on a map scaled to accurately reflect states' physical sizes –
I'll use the phrase "flat" map throughout for such a map –
makes the 2012 election results look pretty even,
slightly favoring the Republican candidate.
(This flat map is an example of a
choropleth map,
a different type of thematic map in which the coloring of subdivisions has meaning.)
In fact,
the election was a win of near landslide proportions
for President Obama
in the Electoral College.
The problem is that much of the red area in the map
is sparsely populated.
Those states have very few electoral votes,
which is what counts.
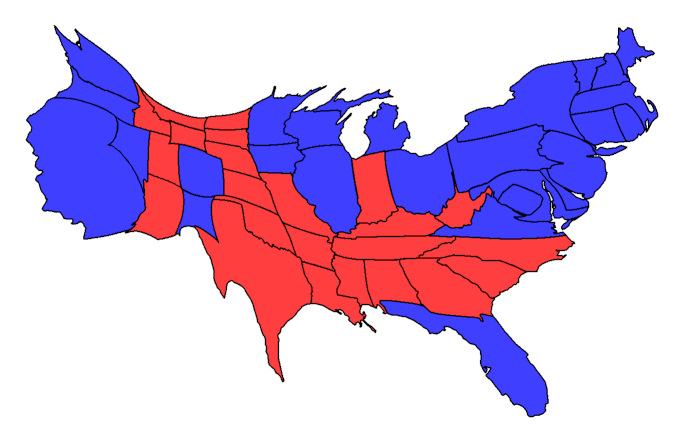
A cartogram of the situation can be constructed so that
the size of each state on the map
reflects the number of electoral votes that state has.
Compared to the flat map,
most of the red states have shrunk, reflecting fewer electoral votes,
while many of the blue states have expanded, reflecting more votes.
The changes in Montana and Washington, DC are particularly noticeable.
In the cartogram,
those two are the same size,
reflecting that both of them have three electoral votes.
(In the flat map, Washington is a barely visible block dot
along the Virginia-Maryland border.)
This red-blue style of cartogram,
at both the state and county level,
has become fairly popular after the last few US Presidential elections.
The election cartogram is an example of a
contiguous cartogram,
in which points that touch in the undistorted map
also touch in the cartogram.
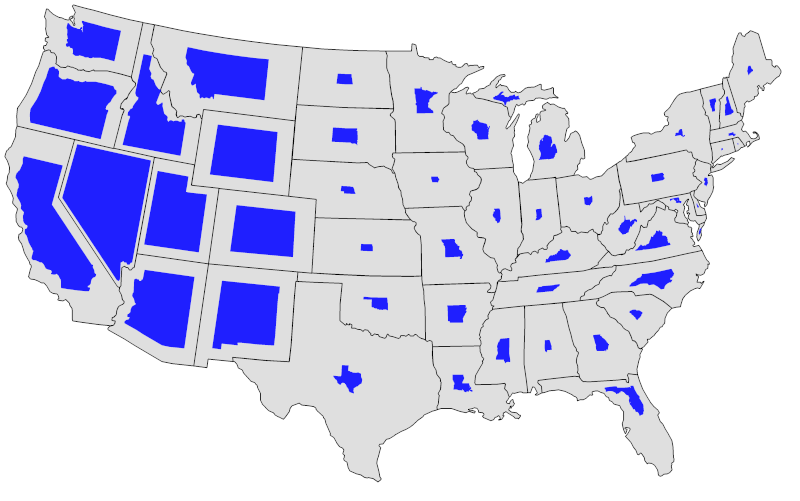
One of the issues that comes up in some of the things that I write
is that of federal land holdings within the individual states.
Within the 48 states I'm using in these examples,
such land holdings are overwhelmingly located in the western states.
A contiguous cartogram produces fairly extreme distortion of
the eastern states and may be difficult to read.
A
non-contiguous cartogram places scaled images within the outlines
of the subdivisions in a flat map.
Here, a blue silhouette whose size represents the size of the federal land holdings
within the outlines of the state.
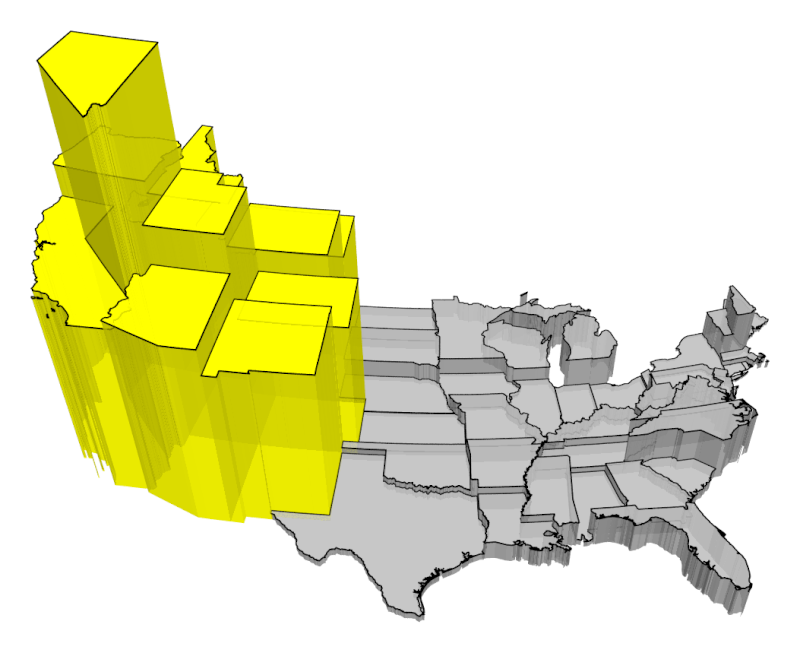
A related type of map is the
prism map.
The same information on federal land holdings within the individual states
is shown here as a prism map.
Each state is represented by a three-dimensional prism.
The horizontal cross-section of each prism
matches the outline shape of the state;
the volume of the prism is proportional to the area of the federal lands.
The tricky part is producing an attractive view of a three-dimensional object
suitable for use in a two-dimensional medium.
Next: Some History
Last updated Mar 4, 2018