
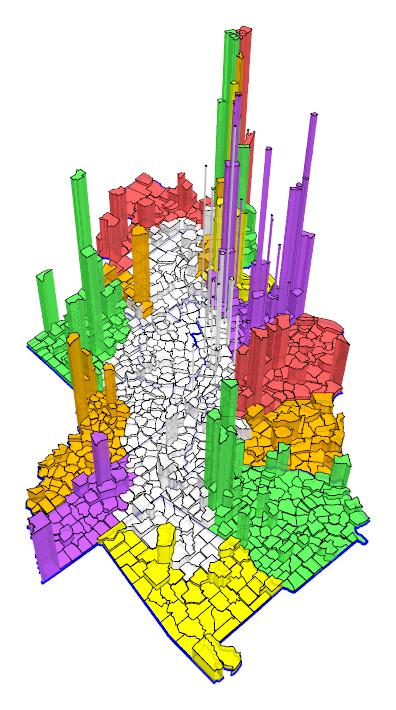
Great Plains counties in white. The prism volume represents population, the prism height represents population density. Making the prism height represent population is terribly misleading.
Population peaked in the 1930 census and has been falling ever since. The current average population density is 9.6 persons per square mile. Twenty percent of the total population is in a half-dozen Texas counties. 222 of 362 counties have fallen to the traditional definition for frontier of seven persons or less per square mile.
Note the regionally large cities that fall just outside the Great Plains borders.
Appalachia counties in white. Prisms have been truncated at the same maximum height as in the Great Plains figure for better consistency. It's much harder to see the state borders because there are very few counties as "flat" as those in the Great Plains.
Total population is about four times the Great Plains total, area is about one third the Great Plains. There are nine counties with a population over 250,000 and two with a population over 400,000. The sixteen most populous counties have almost as many people as the entire Great Plains. Current average population is 119.8 persons per square mile. One of 366 counties meets the frontier threshold.
Largely similar pattern of cities falling outside the borders.
Notes to self:
Command lines for generating these prism maps:
$ perl cartogram.pl -type prism -data great_plains/great_plains.data -generate -map generate/counties.map -overlay generate/states.map -thick 0.75 -overlay_thick 1.5 -camera 1500,255,50 -zoom 55 -ypoint 100
$ perl cartogram.pl -type prism -data population/appalachia.data -generate -map generate/counties.map -overlay generate/states.map -thick 0.75 -overlay_thick 2 -camera 1500,225,50 -zoom 65 -ypoint 50 -transform '($value > 3855) ? 3855 : $value'